

IMPORTANCE OF ACOUSTICS AND MEASUREMENTS Acoustical Measurements help us analyze acoustical parameters of a room that can help the user take informed decisions about the acoustical conditions of that room. Different rooms and areas have different pre-requisites in terms of audio. For example, office spaces, auditoriums, recording studios, clubs etc have different sound pressure level requirements and also acoustical isolation requirements. Furthermore, for most of these spaces, these acoustical parameters are described in publication of International Standards (Eg. IEC / ISO ).

1) Reverberation Time:
The reverberation time of a room or space is defined as the taken by the sound in a room to decay by 60dB. For example, if the sound in a room takes 10 seconds to decay from 100dB to 40dB, the reverberation time would be 10 seconds. This can also be written as the T60 time.
Example:
The following are the measured values of EDT, RT20 and RT30 at a site.
 RT60 = ( time to decay 30 dB ) * 2
 We can see that there is a rise in the frequency bands 80Hz-250Hz which gradually tapers down. T30 at 125Hz band is around 1.2 seconds.
These values can be imported into other acoustical simulation softwares for further analysis to make accurate predictions.
2) Speech Transmission Intelligibility (STI)
STI is defined as a measure of Speech Transmission Quality. It is rated on a 0-1 scale as shown below.
The STI calculated is affected by many parameters such as :
• SPL
• Acoustical parameters of the room in consideration
• Frequency response of the channel
• Background / ambient noise level
• Quality of equipment used
• Masking effects
• Reverberation time etc.
 The below image is an example of a simulated STI result where one can average out the values of STI at each of the frequencies and arrive at a single value to define the overall performance of the system.
 One more related term is STIPA, which stands for Speech Transmission Index for Public Address Systems) is a version of the STI using a simplified method and test signal. STI is measured as per speech transmission index in a room in accordance with the international standards IEC 60268-16 (Edition 4).
3) Sound Pressure Level with RTA
 The above graph is an example of a measured response of SPL being mapped against Frequency in a 1/24 dB Octave Smoothing.
Post installation of the loudspeakers in the hall, pink noise shall be played through the speakers to test the functioning of all the loudspeakers in specific zones, as well as their acoustical parameters be measured using a calibrated, omnidirectional measurement microphone such as Earthworks M50, Audix TM-1, Beyerdynamic MM-1 etc and the results be tabulated and analysed using measurement software such as Rational Acoustics SMAART V8, AFMG Systune or several others.
This would ensure that the simulated results are corresponding to the results obtained after proper installation of the audio equipment. In case of discrepancies, the same can be rectified to ensure that all guidelines are met for.
4) Sound Transmission Class (STC)
Sound Transmission Class (or STC) is an integer rating of how well a building partition attenuates airborne sound. In the US, it is widely used to rate interior partitions, ceilings, floors, doors, windows and exterior wall configurations.
Based on the construction of the wall, STC can be defined.
Examples of STC: (Source - Wikipedia)
P.T.O.
 Pink noise is played in the source room and the resultant SPL is measured in the receiving room and analysed to assess the sound leakage, which is defined as STC.
5) Articulation Loss of Consonants
This defines the loss in clarity of speech where the consonants are lost by a certain percentage value.
Since %ALcons expresses loss of consonant definition, lower values are associated with greater intelligibility. Zero %ALcons indicates perfect clarity. It is generally assumed that the maximum allowable value for typical paging applications is 10 %, assuming that the environment is relatively free of masking noise. For learning environments and voice warning systems, the desired value is 5 % or less.
 6) Noise Criterion (NC)
Noise Criteria (NC) curves are primarily used to rate indoor noise levels. It is important that the background noise levels are within acceptable limits to ensure optimal speech communication for structures ranging from residences and offices to hospitals and schools.
Noise Criteria is calculated by measuring the background noise is a building using a 1/1 octave spectrum and plotting the spectrum along with a set of curves, called NC Curves, ranging from 63 Hz to 8000 Hz. Noise Criteria for a specific measurement is defined as the criteria of the lowest NC Curve which is not exceeded by the noise spectrum.
Eg: The following measurements were taken at studio using Class-A acoustical measurement at the site.

 Hence Noise Criterion for the room to be considered in EASE analysis is NC 24 as per data measured at site and is shown in the plotting above.
 ACOUSTICAL SIMULATIONS:
Acoustical simulation can integrate all of the measured values and can predict various parameters such as audio coverage in a room, its tonality, its clarity and many other parameters.

 Measurement Devices:
Our firm specializes in these aforementioned acoustical measurements using class 1 measurement microphones and gears.
 Our Class 1 Sound Level Measurement devices are compliant with ANSI S1.4 and IEC61762-1:2014.
Acoustical measurements taken for further analysis are:
1) Sound Pressure Level (SPL) at different points in the auditorium seating areas.
2) Reverberation Time (RT60) – T20, T30.
3) Noise Criterion (NC) value of the room.
4) Real-Time Analysis (RTA) with 1/1, 1/3, 1/6 and 1/12 octave resolution. Compliant to IEC-61260- 1:2014
5) Speech Transmission Index (STI) , STIPA, STI full method compliant to IEC-60268-16 edition 4/5 standards.
6) Sound Transmission Class (STC) for identification of audio leakage between rooms and acoustical isolation
between rooms.
7) Loudspeaker Polarity identification.
Upon measurements, a report is generated and submitted to the client. Scope of measurement work ends here.
ACOUSTICAL SIMULATION AND ANALYSIS - with AFMG EASE Software:
1) Designing of the room with acoustical treatment
2) Reverberation time after treatment based on chosen acoustical treatment materials.
3) Speech Transmission Index (STI) of the hall as per IEC 60268-16 Ed4 standards.
4) Articulation Loss of Consonants (Alcons %) to identify clarity losses in speech.
5) Sound Pressure Level dispersion across the entire seating area to ensure all areas of seating gets even audio
coverage.
6) SPL dispersion across multiple frequencies.
7) Incorporation of audio equipment (loudspeakers) in the hall to ensure perfect coverage, tonality, time
alignment etc.
Scope of this work ends with submission of the EASE report that includes all information on the necessary acoustical treatment. 3 site visits will be needed.
AUDIO SYSTEM TUNING:
We are also equipped with industry standard audio tuning and measurement softwares and hardware to tune the proposed audio system via the DSP provided.
Tuning is done via RTA measurements, Transfer Function Analysis, Polarity Check, Time Delay adjustments between speaker components, Waterfall graph analysis and gain shading.
This ensures that the installed audio system sounds perfect for multipurpose applications.
Upon acoustical measurement and analysis, we shall be able to perfectly identify all tonal issues in the room and take necessary steps to ensure perfect audio coverage across the space.
Summary :
By assessing all these acoustical values, an informed definition can be taken in terms of the amount of acoustical isolation needed at a particular site.
Acoustical isolation helps in defining privacy as well as functionality of a particular space. For example, in a recording studio, perfect acoustical treatment is needed to reach the ideal reverberation time level, noise level and acoustical isolation in the room to produce the best quality recording.
Similarly in office spaces, acoustical isolation is needed to ensure privacy between rooms, as well as help in create a suitable noise free environment for long hours of work.
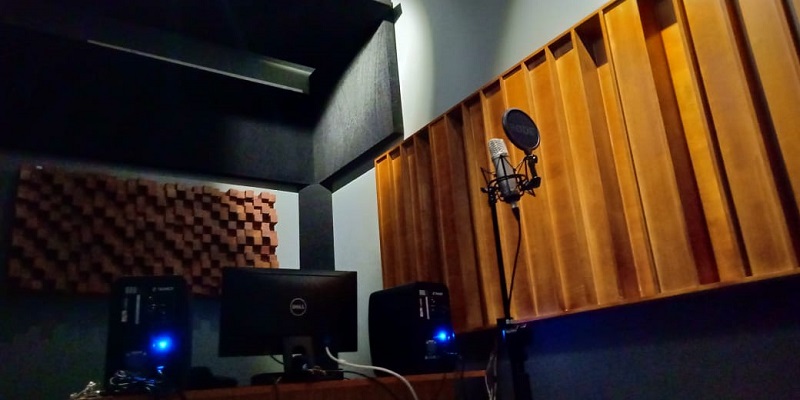
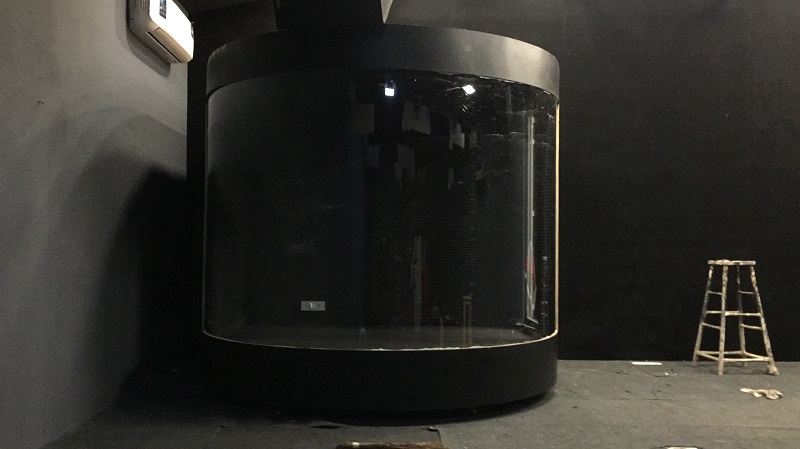
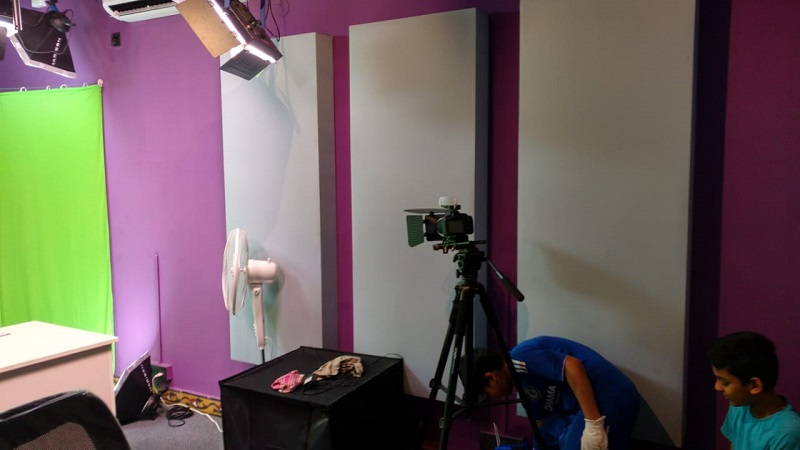
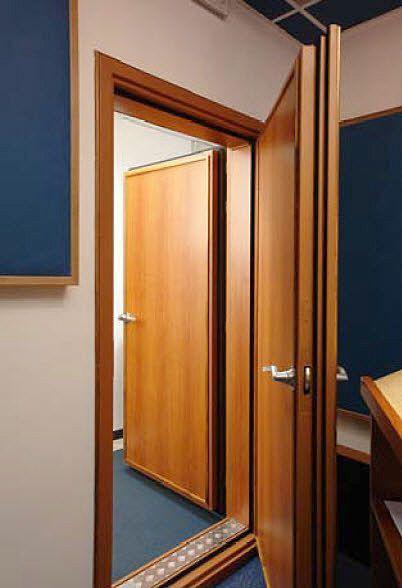
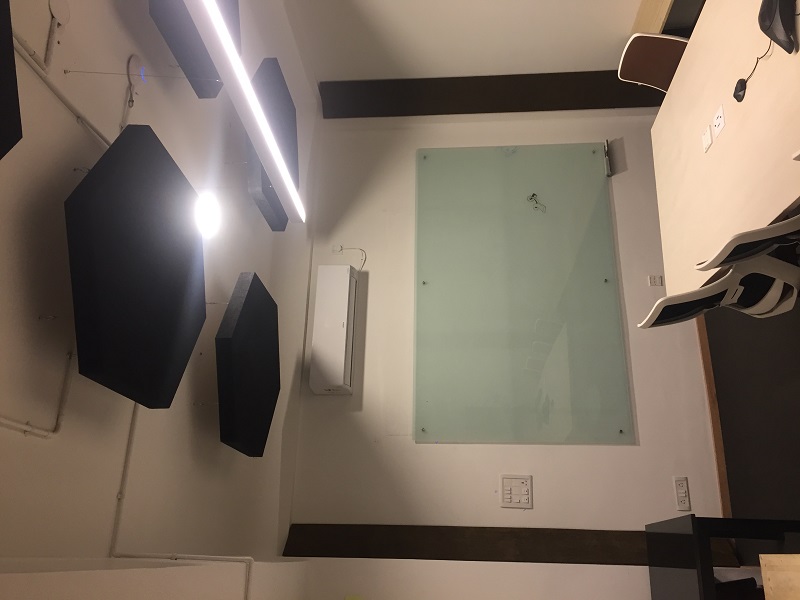
Some of our projects with Acoustic/Sound Proofing Solutions
ACOUSTICAL MEASUREMENTS: We are equipped with Class 1 Sound Level Measurements compliant with ANSI S1.4 and IEC61762-1:2014. Acoustical measurements taken for further analysis are: 1) Sound Pressure Level (SPL) at different points in the auditorium seating areas. 2) Reverberation Time (RT60) – T20, T30. 3) Noise Criterion (NC) value of the room. 4) Real-Time Analysis (RTA) with 1/1, 1/3, 1/6 and 1/12 octave resolution. Compliant to IEC-61260- 1:2014 5) Speech Transmission Index (STI) , STIPA, STI full method compliant to IEC-60268-16 edition 4/5 standards. 6) Sound Transmission Class (STC) for identification of audio leakage between rooms and acoustical isolation between rooms. 7) Loudspeaker Polarity identification. Upon measurements, a report is generated and submitted to the client. The scope of measurement work ends here. ACOUSTICAL SIMULATION AND ANALYSIS with AFMG EASE Software: 1) Designing of the room with acoustical treatment 2) Reverberation time after treatment based on chosen acoustical treatment materials. 3) Speech Transmission Index (STI) of the hall as per IEC 60268-16 Ed4 standards. 4) Articulation Loss of Consonants (Alcons %) to identify clarity losses in speech. 5) Sound Pressure Level dispersion across the entire seating area to ensure all areas of seating gets even audio coverage. 6) SPL dispersion across multiple frequencies. 7) Incorporation of audio equipment (loudspeakers) in the hall to ensure perfect coverage, tonality, time alignment etc. Scope of this work ends with submission of the EASE report that includes all information on the necessary acoustical treatment. 3 site visits will be needed. AUDIO SYSTEM TUNING: We are also equipped with industry standard audio tuning and measurement softwares and hardware to tune the proposed audio system via the DSP provided. Tuning is done via RTA measurements, Transfer Function Analysis, Polarity Check, Time Delay adjustments between speaker components, Waterfall graph analysis and gain shading. This ensures that the installed audio system sounds perfect for multipurpose applications. Upon acoustical measurement and analysis, we shall be able to perfectly identify all tonal issues in the room and take necessary steps to ensure perfect audio coverage across the space.
